ETL;DR
Most IGA programs govern 13–15% of the enterprise application estate. The rest — legacy tools, SaaS without SCIM, shadow IT, custom-built apps — gets handled manually. For a 1,000-person organization, five years of that gap adds up to $12.9M in combined costs. Only 8.3% of that is platform spend. The other 91.7% is the cost of applications that never made it into governance. This article breaks down where that number comes from, and what changes when the gap closes.
Intro
Every IGA program eventually produces the same uncomfortable number.
It surfaces differently — sometimes in a resourcing conversation, sometimes during an audit prep sprint, sometimes when an access review reveals accounts that shouldn't exist. But the number is always there: the percentage of the application estate that's still outside governance. The apps that didn't make the original connector scope. The tools provisioned manually by a helpdesk queue. The SaaS layer that grew faster than the program could follow.
For most enterprise organizations, that number is around 80%.
The question that doesn't get asked often enough is what that number costs — not in risk terms, not abstractly, but in actual dollars over the life of the program.
The Standard Framing Gets It Wrong
The conversation about IGA investment typically focuses on platform cost: license fees, professional services, implementation scope. That's the number in the budget line. It's also the smallest part of what the program actually costs.
A realistic five-year IGA TCO for a 1,000-person enterprise — running SailPoint or a comparable platform, with 100 applications in the estate and 13 governed — includes five distinct cost categories. Two show up in the original budget. Three don't.
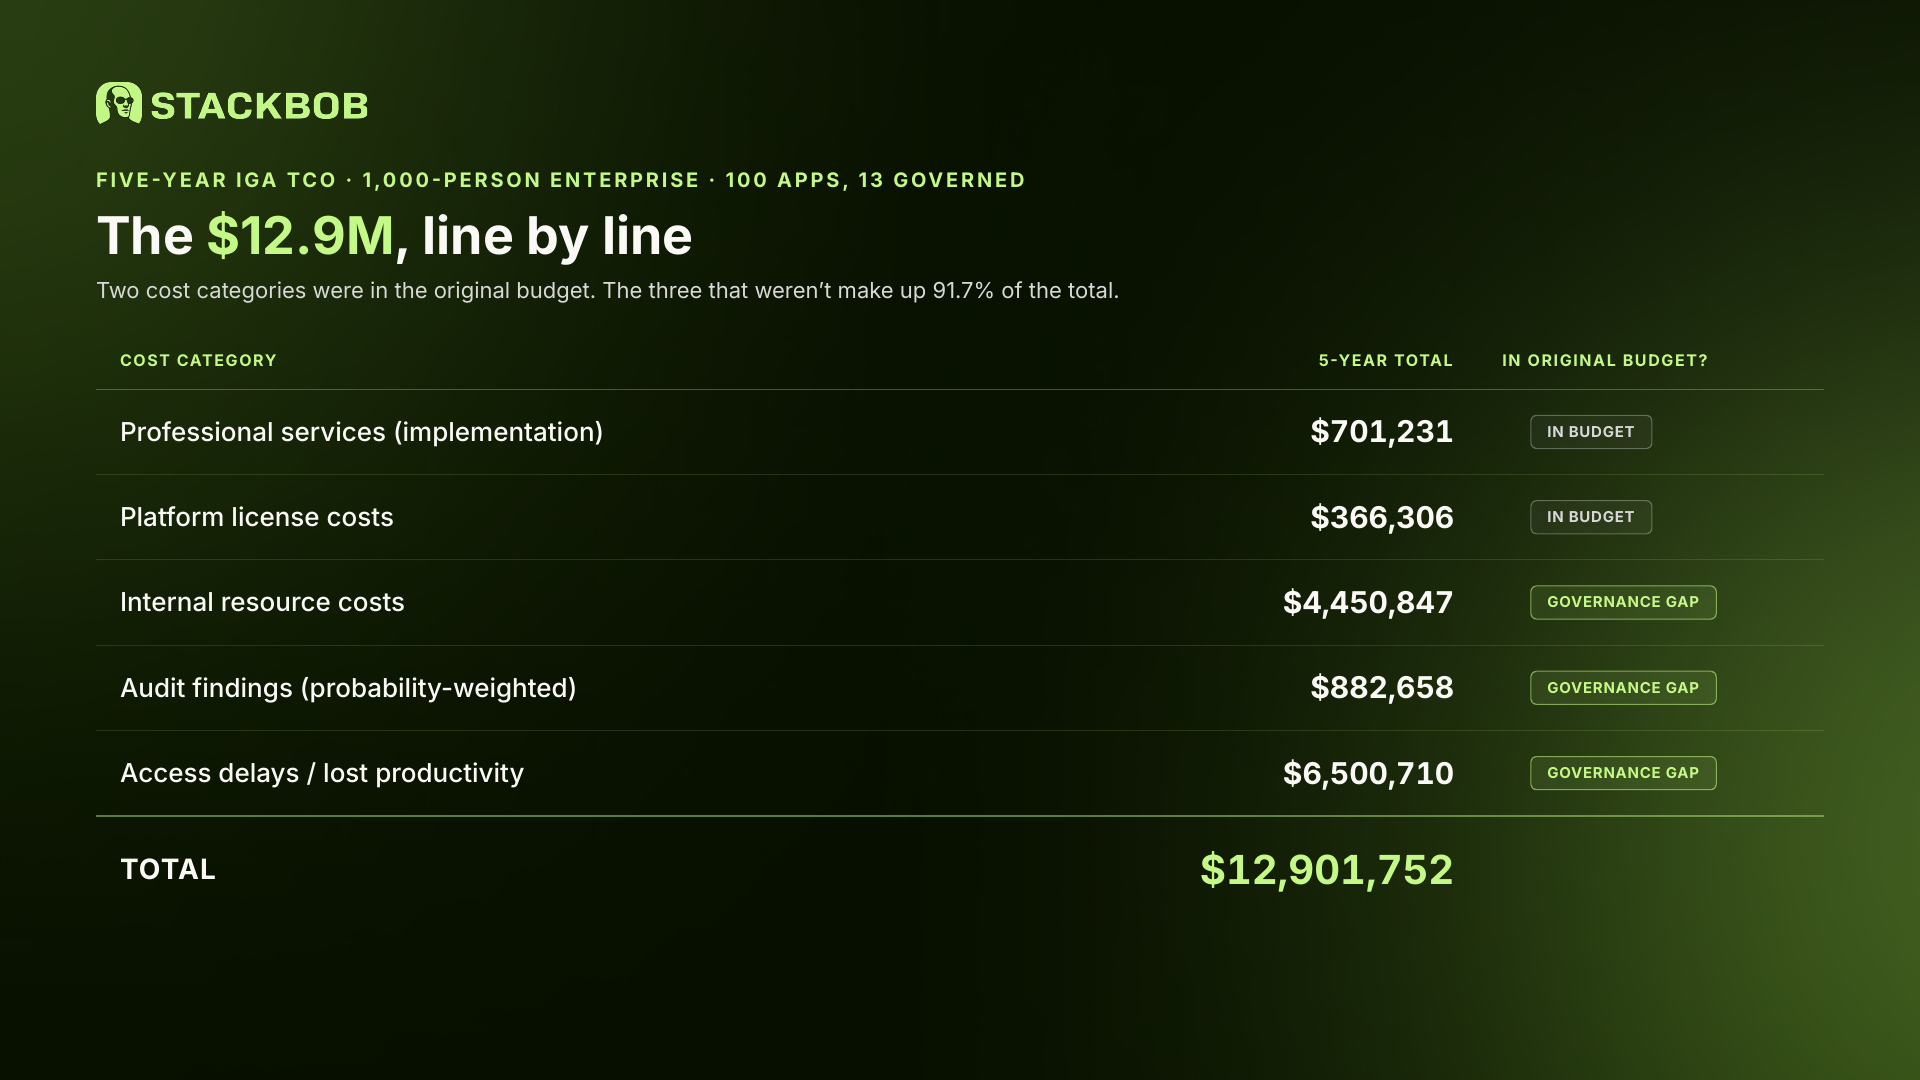
The line items most finance and security leaders focus on — professional services and license — account for 8.3% of the five-year cost. The other 91.7% comes from the governance gap.
Where the $12.9M Comes From
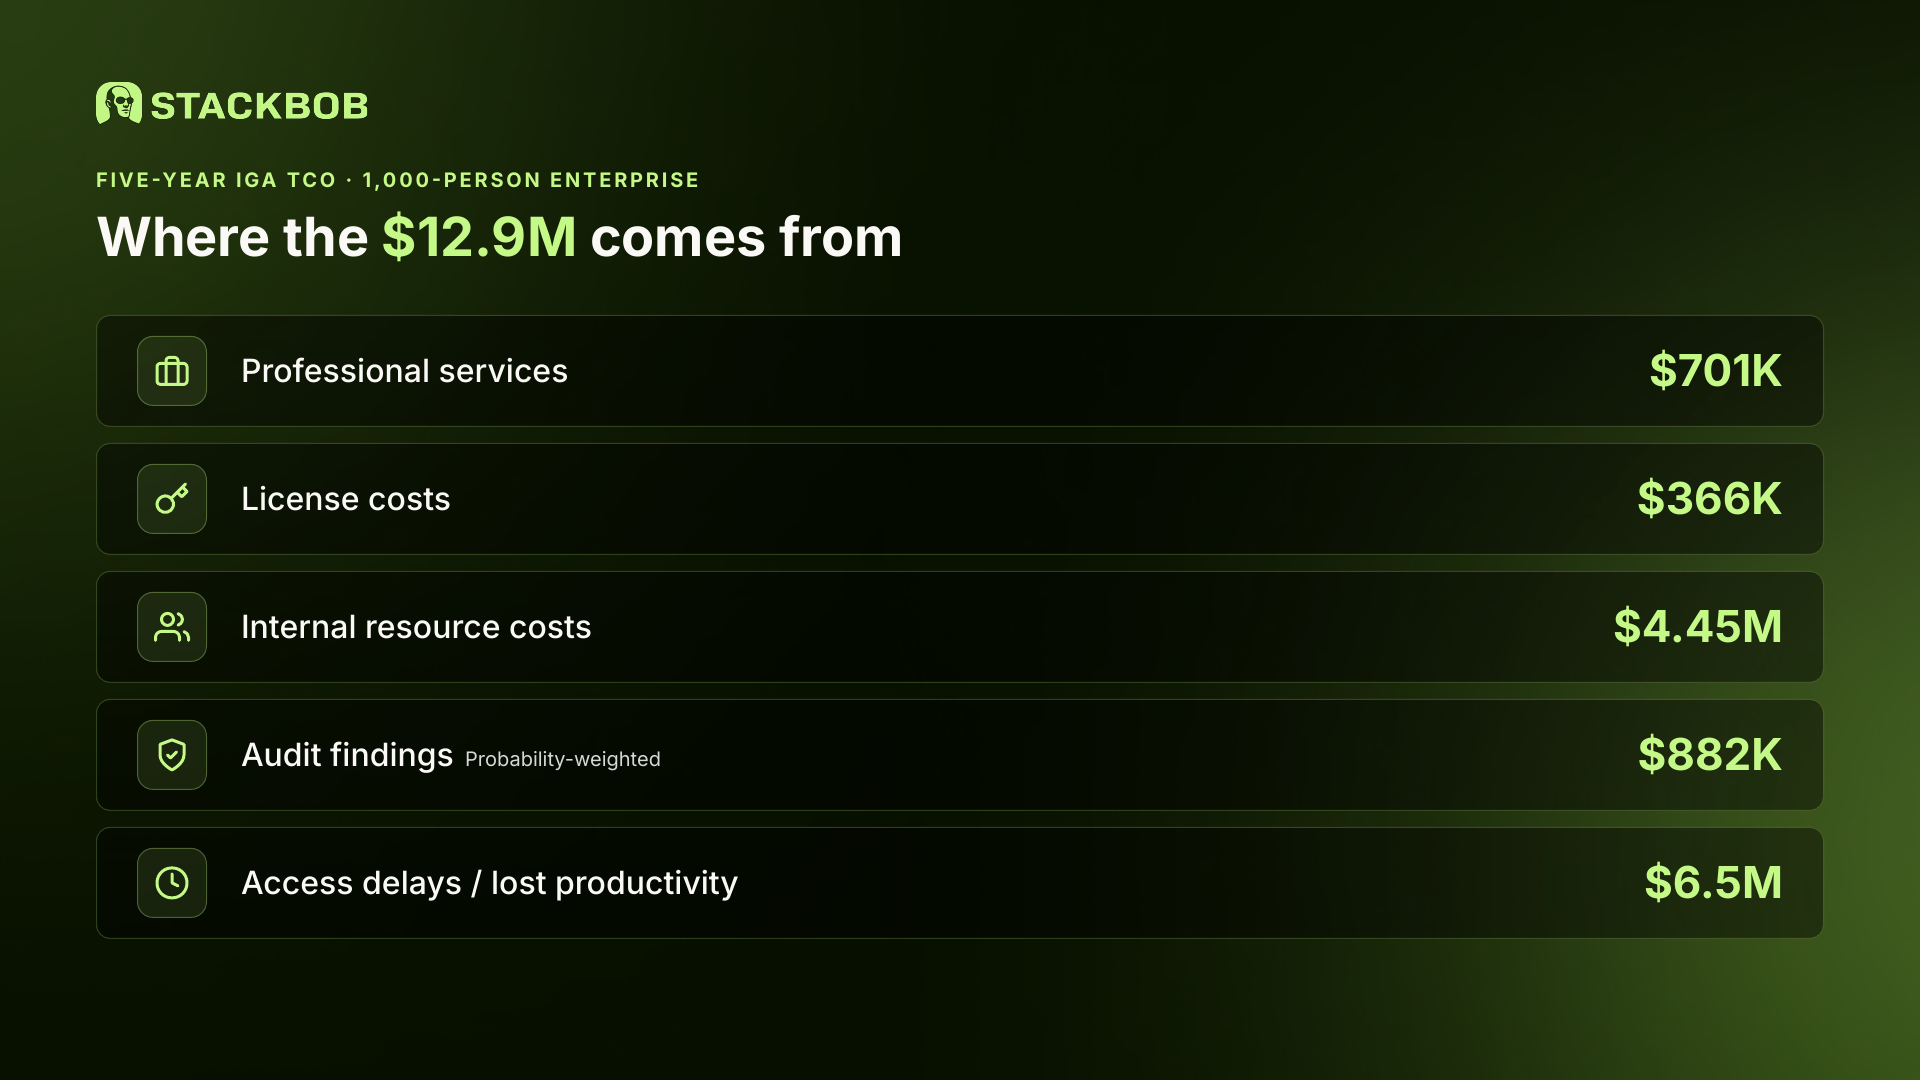
Professional Services: $701K
A full SailPoint implementation for a 1,000-person organization with 10 connectors in scope runs approximately 3,560 combined hours across architect and engineering resources. Phase 2 alone — connector deployment, JML workflow development, certification campaigns — accounts for 2,125 of those hours.
This cost is largely fixed and absorbed in year one. It's the number everyone sees. It's also the number that creates the false impression the program is complete when it isn't.
The implementation covers the connectors in scope. It doesn't cover the other 87 applications in the estate — the ones without SCIM support, without APIs, or simply never prioritized in the original project scope.
License Costs: $366K
License cost for a 1,000-person organization, growing at 10% annually over five years, comes to $366K for the primary IGA platform. Year one is $60K. By year five it's $88K.
This is real cost, but it's the cost of the infrastructure the program runs on — not the cost of the gap. The platform is doing its job on the 13 applications it governs. The problem is the 87 it can't reach.
Internal Resource Costs: $4.45M — The Number Nobody Budgets For
This is where the gap becomes expensive.
Manual provisioning for those 87 ungoverned applications — 10 requests per application per month, 15 minutes per request — requires approximately 217 helpdesk hours per month, or the equivalent of two full-time resources. Added to the IAM architect, two engineers, and IAM manager needed to support the program, total internal staffing runs to $830K in year one and compounds at 3.5% annually for cost-of-living increases.
Over five years, that's $4.45M in internal resource cost. Approximately $3.5M of that is directly attributable to manual fulfillment for applications the IGA platform can't reach.
The math is straightforward: every application outside governance is an application someone is provisioning by hand.
Audit Findings: $882K (Probability-Weighted)
This cost gets undercounted because it's probabilistic. But the probability model is defensible.
For governed applications, audit findings occur at roughly 15% of applications per cycle. For ungoverned applications, that rate is approximately 55%. With four audit cycles per year across 87 ungoverned applications, the expected number of findings is substantial — and each finding averages 10 hours of remediation at a blended rate of ~$62/hour.
Over five years, the probability-weighted cost of audit findings attributable to the governance gap is $882K.
This excludes regulatory penalties, which vary too widely by industry and jurisdiction to model generically. The $882K is remediation labor only.
Access Delays / Lost Productivity: $6.5M — The Largest Number in the Model
This is the number most organizations have never calculated.
When access provisioning runs through a manual queue — a ticket, an app owner, a helpdesk request — delays are common. For ungoverned applications, the probability of an access delay affecting a JML event is approximately 75%. For governed applications with automated JML flows, that probability drops to 10%.
Two lifecycle events per employee per year. Two days of lost productivity per delayed event. $400 per day in loaded cost. At 1,000 employees, 87 ungoverned applications, and a workforce growing at 10% annually: five-year productivity loss from access delays totals $6.5M.
This number doesn't appear on any invoice. It shows up in the gap between how fast people can do their jobs and how fast they should be able to.
What Changes When the Gap Closes
Those 87 ungoverned applications don't have to stay ungoverned.
Extending IGA governance to SCIM-less and API-less applications — the 80% of the estate that traditional connectors can't reach — directly attacks the three largest cost categories in the model.
With 50 additional applications brought under governance using Agentic IGA:
- Internal resource costs drop materially. Manual provisioning requests for governed applications are automated. The two helpdesk resources handling manual fulfillment are no longer running a ticket queue.
- Audit finding probability falls from 55% to 15% for newly governed applications. Finding remediation cost for that cohort decreases proportionally.
- Access delay probability falls from 75% to 10% for newly governed applications. The productivity loss line shrinks accordingly.
The license cost for extending governance is additive — and significantly lower than the total cost it displaces. At $120/user/year for StackBob's Govern tier, extending to 50 additional applications costs $693K over five years for a 1,000-person organization growing at 10% annually.
The costs it attacks are measured in millions.
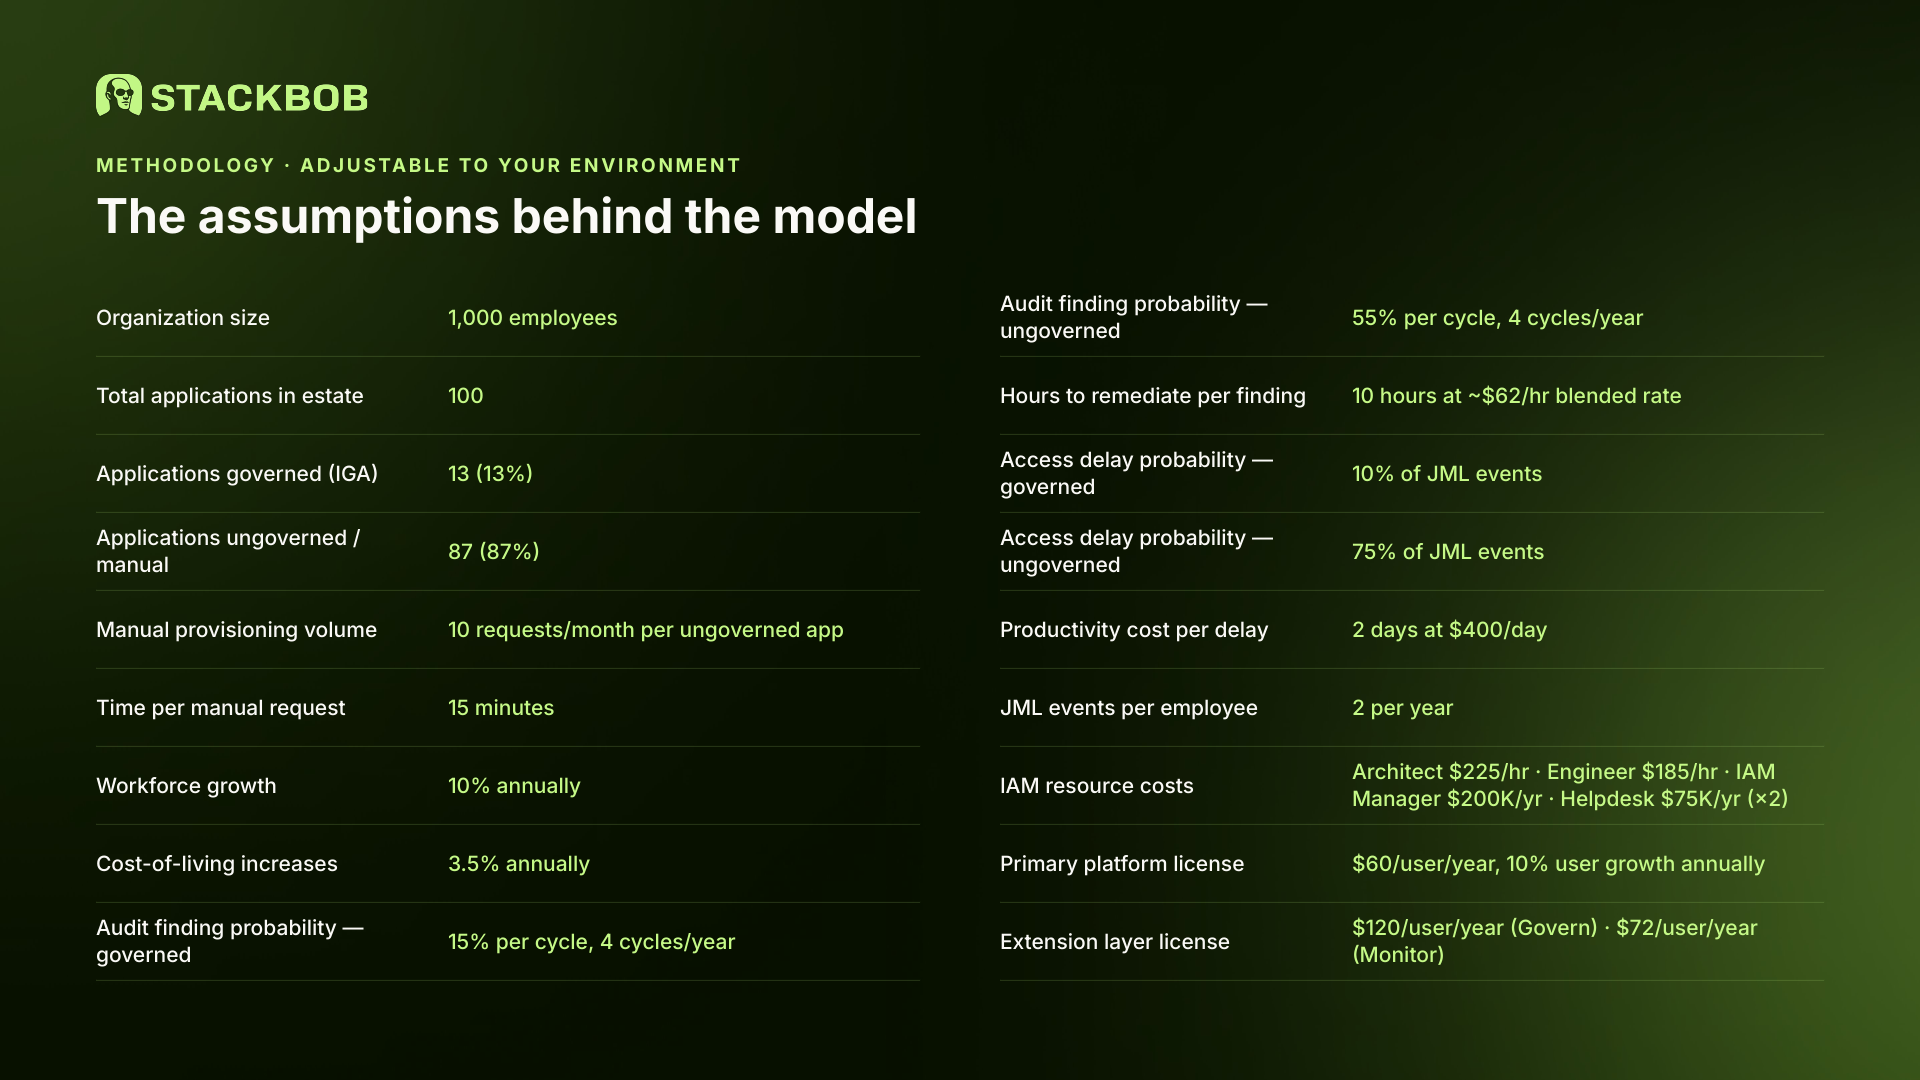
The Assumptions Behind This Model*
Every number above is derived from operational inputs, not analyst estimates.
These assumptions scale. A 2,000-person organization with 300 applications doesn't change the structure — it changes the magnitude. The ratio holds: the governance gap costs significantly more than the governance program.
*Methodology: Figures are based on operational inputs typical of a 1,000-person enterprise with 100 applications. Professional services data derived from a real SailPoint implementation LOE. Audit finding and access delay costs use probability-weighted models based on observed rates across governed and ungoverned application cohorts. All assumptions are adjustable to specific organizational parameters.
The Coverage Gap Has a Price
The gap rarely gets discussed in cost terms. It gets framed as risk ("ungoverned apps are a breach vector"), as compliance ("auditors want full lifecycle coverage"), as operations ("we still have a manual queue"). Those framings are accurate. They don't produce budget decisions.
Cost framing does.
When the access delay and resource cost calculations run against a real application estate — actual employee count, actual application count, actual proportion governed — the number is usually large enough to justify the extension conversation on financial grounds alone, without invoking breach probability or audit exposure.
The gap has a price. Most organizations have never added it up.